Nice datavisualization / Infographics for a series of graphics
- Статус: Closed
- Винагорода: €300
- Надіслані роботи: 8
- Переможець: mountrushmore673

Стисле описання конкурсу
I would like to convert into nice datavisualization / infographics a series of 13 basic charts or tables.
For instance, in the attached document Rice PLW, I would like that the charts contained in figure 1 be merged into a single chart (firts option) or transformed into a nice infographics (comparator: https://www.propointgraphics.com/wp-content/uploads/2016/05/PPG_GGL23809_Think_Health-01-360x210.png or https://blog.kurtosys.com/wp-content/uploads/sites/2/2015/01/dataviz_agriculture.jpg or https://i.pinimg.com/736x/db/04/36/db043650c801e0b15cd51eec2c3e0535--milk-industry-dairy-cattle.jpg).
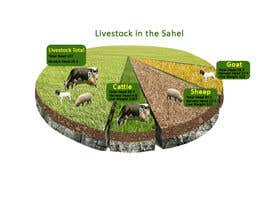
In the Sahel document, the table should also be converted into a nice infographics, in keeping with the same spirit used for the first infographics) or a nice chart.
In the attached PowerPoint document, we just need to make the organization chart more appealing and attractive.
When the job is finished, I will need to get all the original files (either Excel, Word, Adobe Illustrator) in order to be able to edit them if need be.
I will have a total of 13 charts to edit, with a deadline for tomorrow morning.
Рекомендовані навички
Відгук роботодавця
“Jason was quite attentive to my needs. Did a great job. ”
![]() ChawkiChahed, Cote D'Ivoire.
ChawkiChahed, Cote D'Ivoire.
Публічна роз'яснювальна дошка
Як організувати конкурс
-

Опублікуйте свій конкурс Швидко та просто
-

Отримайте безліч конкурсних робіт З усього світу
-

Оберіть найкращу роботу Завантажуйте файли - це просто!